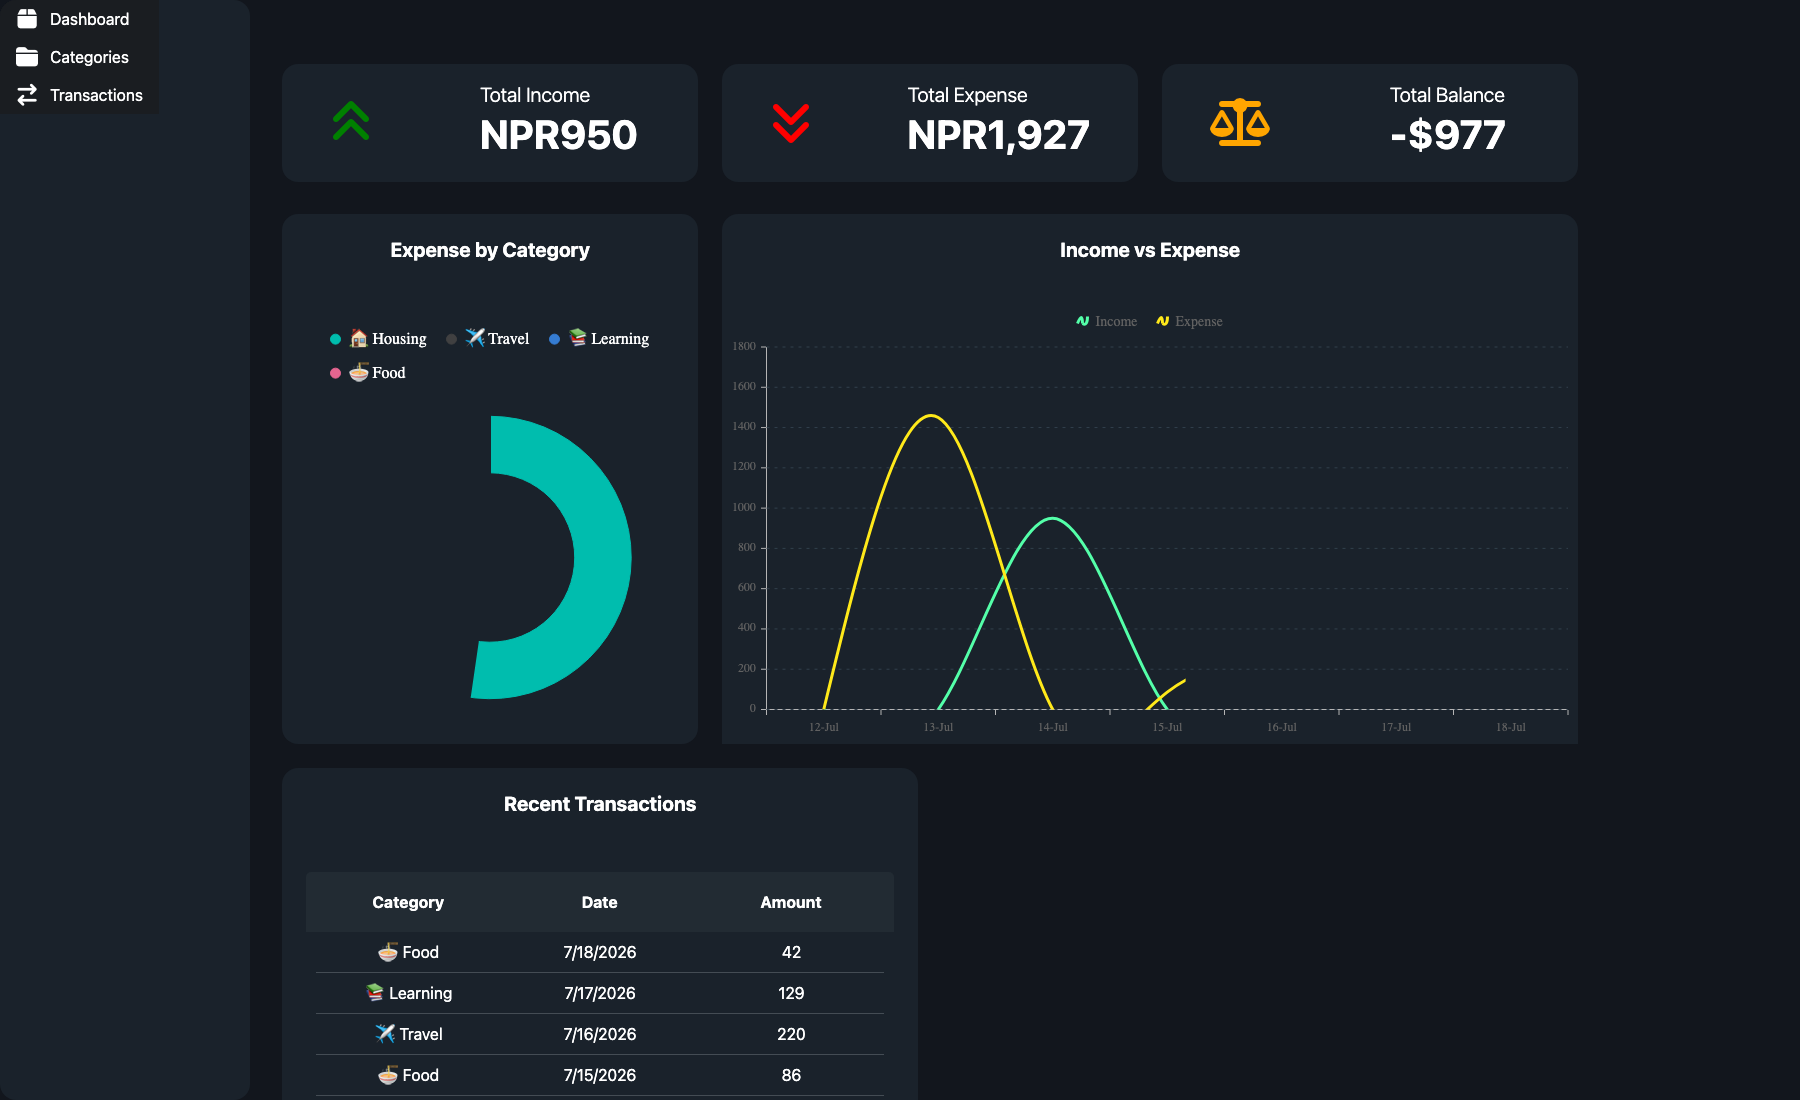
The complete financial dashboard with summaries and charts
Overview
Expense Tracker turns everyday transaction records into an understandable
financial overview. It supports category and transaction management, then uses
those records to build a visual dashboard for income, expenses, and recent
activity.
Engineering highlights
Created category and transaction workflows with ASP.NET Core MVC
Used Entity Framework Core migrations to evolve the relational data model
Aggregated transaction data for dashboard summaries and recent activity
Integrated Syncfusion controls for richer charts and interface components
Distinguished income and expense categories to make reports meaningful
Added validation around the data-entry workflows
What I learned
The important part of this project was not only storing transactions, but
transforming them into useful information. It gave me practical experience
shaping backend queries around what a dashboard needs to communicate clearly.